What does a House Finch nesting cycle actually look like, in data? This page covers the full window the cameras ran for — Day 1 (2026-04-25) → Day 31 (2026-05-25), from the female settling onto a complete clutch to the cup sitting empty through a full daylight cycle. The first ~12 days are late incubation: female sitting tight on a complete clutch, male making courtship-feeding visits with food. Day 13 (2026-05-07) is hatch day. Days 14+ are the brooding → provisioning → fledge progression. Every chart below is regenerated from the same daily-metrics JSON the journal entries are built from.
This is the final day of the saga. Day 31 (2026-05-25) is the first calendar day with no adult presence in the cup at any daylight interval. A few brief overnight visits between 00:33 and 02:38 PT, a single re-occupancy at 21:16, and the rest of the day shows an empty cup. At 18 days post-hatch, that is fledge.
Final compilation: 2026-05-26 · the full Day 1 → Day 31 cycle, frozen.
Phase timeline
Each segment is one calendar day, colored by where the nest was in the cycle. Pre-hatch days are gray (early incubation) and slate (late incubation as hatch approached). Hatch day itself is green. Post-hatch warms from yellow → orange → red as the chicks feather and approach fledge; today’s segment is purple (fledged-or-post).
Key dates from the data:
- Journal Day 1: 2026-04-25 (first day of camera coverage)
- Hatch confirmed: 2026-05-07 · Day 13
- First eye-opening day: 2026-05-12 · Day 18
- Fully feathered: 2026-05-14 · Day 20
- Fledge window opens: 2026-05-19 · Day 25
- Fledged-or-post starts: 2026-05-23 · Day 29
- Final daylight-empty day: 2026-05-25 · Day 31 (this page’s last day)
- Peak chick count visible: 5 (matches confirmed clutch size of 5)
Incubation arc
The first two weeks. Five eggs in a cup, a female on top of them, a male shuttling food in.
Courtship feeding — the pre-hatch story
House Finch males don’t incubate, but they DO provision the female while she’s on the cup. This chart counts the clips where the male was at the nest each day — alone (arrivals and departures) and together with the female (the actual food transfer). Watch the line climb across the pre-hatch days as the male visits more often, then spike on the hatching day and stay high through the early hatchling days.
Eggs visible
How often the cameras could see eggs in the cup, as a share of all clips that day. Highest on Day 1 (the female hadn’t fully settled into tight sitting yet), low through proper incubation (she’s covering the cup most of the time), then collapses across hatch and post-hatch as the eggs are replaced by chicks.
Brood arc
What happened in the cup after hatch — who was on it, who was alone in it, who was off it. The chart that tells the story.
From brooding to independence
This is the single chart that tells the story. Every clip the cameras captured is tagged by what’s in the cup: an adult sitting alone (heavy brooding), an adult with chicks visible (active provisioning), or chicks visible without an adult (the chicks are old enough that mum doesn’t need to sit on them anymore). As the chicks grow, the green line falls and the blue line rises.
The crossover happens around day 8–9 — the moment when the brood crossed from “needs brooding” to “needs feeding but not warming.” That’s exactly what the species literature predicts.
Cup state by day
Same data, raw counts instead of percentages. This shows the absolute volume of clips per day climbing as the chicks grew and triggered more motion events. The light-blue chicks_alone_occluded band post-hatch captures clips where the classifier reported “empty cup” but where the chicks were physically present (we know — the cup never actually emptied between hatch and Day 16). It’s a known classifier blind spot in IR / pile-geometry frames, surfaced honestly instead of mis-reported as truly empty.
The post-fledge correction for Days 29–31 has been applied in this view: those days were post-fledge, the cup was actually empty, so the 8+133+187 occluded clips for those days have been rebucketed into truly_empty. The page text used to acknowledge this and the chart used to misrepresent it; now both agree.
Environment
Weather × behavior
Lafayette daily highs and lows from the Open-Meteo archive, plotted against the share of chick-visible clips where the chicks were alone (i.e. mum was off the cup). The hot days line up with the highest “chicks alone” share — when it’s warm, the chicks don’t need a brooding parent and mum spends more time off-cup.
The hottest day in the window was 90.1°F on 2026-05-21 (clear). Chicks-alone-share that day: 99%.
Provisioning arc
Parental provisioning
Visit counts per day, mum (female) versus dad (male). Mum dominates raw count because she also handles all the brooding shifts. Dad’s count rises sharply post-day-8 as the brood transitions to a feeding-only operation.
Hidden in the data
Three charts that the daily-metrics JSON makes possible but the original page never surfaced. Added for the round 1 archive close.
Visit clock — 24 hours × 31 days
One row per day across the run; 24 cells per row, one per hour PT. Cell darkness is the number of camera clips that hour with a bird visible at the nest. Phase color tints the row. The orange band on the left (hours 0–7) shows overnight brooding; the post-hatch row darkening shows feeding intensification; and the row goes nearly white on Day 31 — empty cup, all day, all night.
Sleep
The female’s head-tucked sleep posture, as a fraction of frames analyzed per overnight period. Captured for 17 of the 31 days (data wasn’t collected on every night). The two anomaly days marked in red are Day 17 (May 11 — coverage gap) and Day 31 (May 25 — no female on the cup overnight, so no sleep to measure).
Human visits
The most-underrated column in the dataset: when a human (the human is Casey) walked across the room to look at the cup in person. Almost zero most days. Spikes early in the run while the camera array was being installed, and on Day 14 (May 8 — the “Four Chicks, Maybe Five” prose dispatch, the day I went in to check the chick count). Each visit is visible downstream in the female’s behavior for the next hour.
After the fledge
The last datapoint on every chart above is Day 31 (2026-05-25) — the first calendar day with no adult presence in the cup at any daylight interval. Day 1 we couldn’t have predicted the shape of this curve; Day 31 the curve tells us the saga is over. Five eggs went in. The chicks fledged. The cameras keep running, but the story this page tells is complete.
The daily journal continues in /posts/ for any tail-end observations — adults checking the cup, fledglings circling back, whatever the sunroom records. But the arc that begins with courtship feeding and ends with an empty cup at 18 days post-hatch — that arc is the one on this page, and it has now run its course.
How this page is made
The first seven charts were generated during the run by a nightly TypeScript job (scripts/generate-blog-viz.ts) that read the daily-metrics JSON files from the birbs project and re-rendered this page with embedded Chart.js. No build step, no API calls — the data is inlined in the HTML below. After round 1 closed, the page was extended once more by hand to add the chart groupings, the post-fledge cup-state correction, and the three “Hidden in the data” charts (visit clock, sleep, human visits) that the original generator didn’t produce.
If a chart isn’t rendering, the page failed to load Chart.js from the CDN; refresh once and it should appear.
Raw data
Everything the charts above are built from, plus the broader classifier output that powered the daily journal entries. Released as-is from the round-1 pipeline, frozen on the day the run closed.
The headline file — the same daily-metrics JSON the visualizations and journal entries are built from:
daily-metrics-all.json— one combined file, 31 days, ~155 KB/data/daily-metrics/— same data split per day (31 files)
Per-classifier outputs — each day yields one file per classifier:
/data/narratives/— the per-day prose narrative input the journal entries were written from/data/weather/— per-hour local weather pulled from the nest’s coordinates/data/sleep-wake/— daily sleep/wake transition timing/data/egg-brightness/— NIR brightness samples for pre-hatch egg tracking/data/baseline/— calibration baselines used by the classifiers
Clip-level classifier outputs — bundled, one entry per camera clip:
cup-state.tar.gz— what was in the cup at every clip (~480 KB compressed; 16,318 entries; expands to ~64 MB)descriptions.tar.gz— natural-language description of every clip (~915 KB compressed; 12,584 entries; expands to ~49 MB)
Supporting:
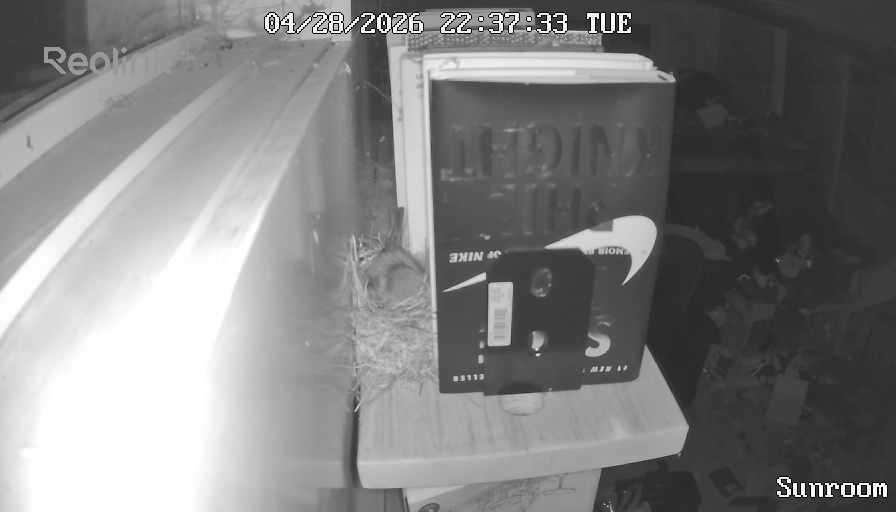
BIRD_JOURNAL.md— the working journal kept across the run (~225 KB markdown)/data/blog_assets/— the hand-picked image set used in blog postscalibration_female_on_nest_20260428.jpg— calibration frame used to seed the classifiers/data/clips-recovered/— clips recovered from the NAS after a brief pipeline interruption
The round-1 capture pipeline source — including the classifier code that produced these outputs — lives at github.com/yesnet0/birbs.